Jun 29, 2015, 5:18 PM
[CLOSED] Questions about CartesianChart objects
Hello,
I'm trying to make a CartesianChart object, specifically a column chart, and I am running into some issues. I am trying to create a function that will take a new CartesianChart object by reference and will modify it (adjust the axes, change the theme, add the data, and so on). Because of that, for any answers to my questions to be useful they have to be things I can do outside of the aspx file. I'm writing this function in F#, but any answers in C# are fine.
Here is an example of a chart I am making:
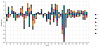
And here are my questions:
1. Adjusting which categories get shown. As you can see in the example picture, not all of the categories on the x-axis are being shown so that they don't overlap. I would like to make it so that all the categories show even if they overlap. I noticed in the documentation that CategoryAxis should have a boolean for whether or not the number of categories should be calculated ( http://docs.ext.net/index.html#topic...00000148C.html ), but when I am actually working with the objects they don't seem to have this property.
So how do I adjust this property in C# or F#?
2. Determining what happens when the mouse is hovering over a bar. In the example code the bar series is given a Tooltip so that when the mouse hovers over the bar a text box appears:
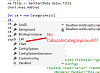
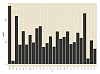
3. Background color. How do I change the background color of just the graph? Setting the Chart.Background color changes the color of the entire chart (including, for instance, the color behind the axis labels). I'm interested in changing the background color only in the space where the gridlines appear. Here is a picture showing what I would like; notice that the beige only appears behind the graph area, and isn't showing up behind the axis labels:
4. Bar color. I see that you can change the colors of the bars in a stacked chart by adjusting the theme, but is there a simple way to say this particular field should be rendered with this color? Specifically, can I link fields in the data to color strings?
Thanks!
I'm trying to make a CartesianChart object, specifically a column chart, and I am running into some issues. I am trying to create a function that will take a new CartesianChart object by reference and will modify it (adjust the axes, change the theme, add the data, and so on). Because of that, for any answers to my questions to be useful they have to be things I can do outside of the aspx file. I'm writing this function in F#, but any answers in C# are fine.
Here is an example of a chart I am making:
And here are my questions:
1. Adjusting which categories get shown. As you can see in the example picture, not all of the categories on the x-axis are being shown so that they don't overlap. I would like to make it so that all the categories show even if they overlap. I noticed in the documentation that CategoryAxis should have a boolean for whether or not the number of categories should be calculated ( http://docs.ext.net/index.html#topic...00000148C.html ), but when I am actually working with the objects they don't seem to have this property.
So how do I adjust this property in C# or F#?
2. Determining what happens when the mouse is hovering over a bar. In the example code the bar series is given a Tooltip so that when the mouse hovers over the bar a text box appears:
<Tooltip runat="server" TrackMouse="true" StyleSpec="background: #fff">
    <Renderer Handler="this.setHtml(storeItem.get('Name') + ': ' + storeItem.get('Data1') + '%');" />
</Tooltip>3. Background color. How do I change the background color of just the graph? Setting the Chart.Background color changes the color of the entire chart (including, for instance, the color behind the axis labels). I'm interested in changing the background color only in the space where the gridlines appear. Here is a picture showing what I would like; notice that the beige only appears behind the graph area, and isn't showing up behind the axis labels:
4. Bar color. I see that you can change the colors of the bars in a stacked chart by adjusting the theme, but is there a simple way to say this particular field should be rendered with this color? Specifically, can I link fields in the data to color strings?
Thanks!
Last edited by Daniil; Jul 01, 2015 at 2:51 PM.
Reason: [CLOSED]


