Feb 03, 2017, 10:54 AM
[CLOSED] RectangleSprite height is cut off in cartesian chart
Dear EXT.NET Team,
I have a question regarding my custom chart and the renderer. I am adding a rectangle Sprite to the chart based on my store data. The rectSprites have a dynamic height, proportional to the ChartColumn's height. You can see the implementation in ErrorChart.cshtml: 87-88; 110. The result right now is not wished, because the rectSprite height is cut off, if the ChartColumn's height value is too big. You can see it in the Screenshot below. The height is not being scaled and it gets cut off (the column where teh pointer is in the screenshot):
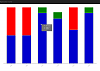
The Question is, how can I make the rectSprite height and ChartColumn's height scale to eachother without being cut off?
ErrorChart.cshtml:
I have a question regarding my custom chart and the renderer. I am adding a rectangle Sprite to the chart based on my store data. The rectSprites have a dynamic height, proportional to the ChartColumn's height. You can see the implementation in ErrorChart.cshtml: 87-88; 110. The result right now is not wished, because the rectSprite height is cut off, if the ChartColumn's height value is too big. You can see it in the Screenshot below. The height is not being scaled and it gets cut off (the column where teh pointer is in the screenshot):
The Question is, how can I make the rectSprite height and ChartColumn's height scale to eachother without being cut off?
ErrorChart.cshtml:
@using Ext.Net
@using Ext.Net.MVC
@{
    ViewBag.Title = "Error Chart";
    var X = Html.X();
}

@(Html.X().ResourceManager())

<!DOCTYPE html>
<html>
    <head>
        <meta charset="utf-8" />
        <meta name="viewport" content="width=device-width, initial-scale=1.0">
        <title>@ViewBag.Title</title>

        <script>
            var axesScaleFactor = 0.9;
            var onSwipe = function(e) {
                var offset = parseInt(App.Offset.value);
                switch (e.direction) {
                case "left":
                    App.Offset.setValue(offset + 1);
                    break;
                case "right":
                    App.Offset.setValue(offset - 1);
                    break;
                case "down":
                case "up":
                    handleUpDown(e.direction);
                    console.log(App.AggregationId.value + ' swiped ' + e.direction);
                    break;
                default:
                }
                //console.log(App.Offset.value +' swiped ' + e.direction);
                App.ChartStore.reload();

            }
            Number.prototype.mod = function(n) {
                return ((this % n) + n) % n;
            }
            var handleUpDown = function(direction) {
                var aggs = ['Hour', 'Day', 'Week'];
                var index = aggs.indexOf(App.AggregationId.value);
                if (direction == 'down') index++;
                else index--;

                App.AggregationId.setValue(aggs[index.mod(3)]);
                var aggrName = aggs[index.mod(3)];

                var rndNumber = Math.floor((Math.random() * 1000) + 100);
                App.Comparison.setText("Vergleich Vorjahr: " + Math.floor((Math.random() * 1200) + -300));

                switch (aggrName) {
                case "Day":
                    App.Frequency.setText("Wochenfrequenz: " + rndNumber);
                    break;
                case "Week":
                    App.Frequency.setText("Jahresfrequenz: " + rndNumber);
                    break;
                case "Hour":
                    App.Frequency.setText("Tagesfrequenz: " + rndNumber);
                    break;
                default:
                }

            }

            function renderData(sprite, config, rendererData, index) {
                var store = rendererData.store,
                    storeItems = store.getData().items,
                    record = storeItems[index],
                    surface = sprite.getParent(),
                    sprites,
                    rectSprite,
                    changes = {};

                if (!record) {
                    return;
                }
                var past = record.get("Past");
                var present = record.get("Present");

                if (!past || !present)
                    return; //no need to further handle rendering

                var dataDiff = present - past;
                var spriteHeight = (dataDiff / present) * config.y;

                var spriteColor = dataDiff > 0 ? 'green' : 'red';
                sprites = surface.mysprites;

                if (!sprites) {
                    sprites = surface.mysprites = [];
                }

                rectSprite = sprites[index];

                if (!rectSprite) {
                    rectSprite = sprites[index] = surface.add({ type: 'rect' });
                } else {
                    rectSprite.show();
                }

                config.y = config.y * axesScaleFactor;
                rectSprite.setAttributes({
                    x: config.x,
                    y: config.y + 2,
                    width: config.width,
                    height: Math.abs(spriteHeight), // --> spriteHeight is the dynamical height for the rectSprite (See line:88-89),
                    fillStyle: spriteColor,

                }, true); //todo avoidcopy=true as well?

                return changes;
            }

            function renderTooltipS1(toolTip, record, ctx) {

                var past = record.get("Past");
                var present = record.get("Present");
                var forecast = record.get("Forecast");

                if (forecast != null) {
                    toolTip.setHtml('Forecast: ' + forecast);
                } else {
                    var dataDiff = present - past;
                    toolTip.setHtml("<content>" +
                        "<div>" +
                        "<ul>" +
                        "<li>Present: " + present + "</li>" +
                        "<li>Past: " + past + "</li>" +
                        "<li>Diff: " + dataDiff + "</li>" +
                        "</ul>" +
                        "</div>" +
                        "</content>");
                }

            }
        </script>
    </head>
    <body>
        @(Html.X().Container()
              .ID("ChartContainer")
              .Height(800)
              .Layout(LayoutType.VBox)
              .LayoutConfig(new VBoxLayoutConfig()
              {
                  Align = VBoxAlign.Stretch,
                  Pack = BoxPack.Start
              })
              .Items(
                  X.Container().Layout(LayoutType.Card)
                      .ID("passerbyCardLayout")
                      .Flex(7)
                      .Items(
                          X.CartesianChart()
                              .ID("passersbyChart")
                              .Flex(3)
                              .SetActiveItem(0)
                              .Plugins(p => p.Add(X.ChartItemEvents()))
                              .Listeners(l => { l.Swipe.Fn = "onSwipe"; })
                              .Bin(
                                  X.Hidden().ID("Offset").Value(0))
                              .InsetPadding(40).Flex(1)
                              .Store(Html.X().Store().ID("ChartStore")
                                  .Model(Html.X().Model().Fields(f =>
                                  {
                                      f.Add(Html.X().ModelField().Name("Intervall"));
                                      f.Add(Html.X().ModelField().Name("Present"));
                                      f.Add(Html.X().ModelField().Name("Past"));
                                  })).Proxy(Html.X().RestProxy().AppendAction(false).Reader(
                                      Html.X().JsonReader().RootProperty("data")).API(urls => { urls.Read = Url.Action("GenerateDummyData", "Chart", new {locationId = Guid.NewGuid()}); })
                                  ).Parameters(pm => { pm.Add(new StoreParameter("offset", "App.Offset.value", ParameterMode.Raw)); })
                              )
                              .Axes(
                                  Html.X().CategoryAxis()
                                      .Position(Position.Bottom)
                                      .Fields("Intervall")
                                      .Label(Html.X().ChartLabel().RotationDegrees(-45))
                              )
                              .Series(
                                  Html.X().BarSeries()
                                      .XField("Intervall")
                                      .StyleSpec(Html.X().Sprite()
                                          .FillStyle("#0000CD"))
                                      .YField(new[] {"Present"})
                                      .Titles(new[] {"Present"})
                                      .Renderer(r => r.Fn = "renderData")
                                      .Tooltip(Html.X().ChartTip().TrackMouse(true)
                                          .Renderer(x => x.Fn = "renderTooltipS1"))
                              ))
              ))
    </body>
</html> public StoreResult GenerateDummyData()
{
//get the location
//get the counts for location with granularity and offset
var data = new List<object>();
var rnd = new Random();
//Hour aggregation
for (var i = 8; i < 14; i++)
{
data.Add(new { Intervall = i + ":00", Present = rnd.Next(5, 12), Past = rnd.Next(5, 12) });
}
return new StoreResult(data);
}
Last edited by fabricio.murta; Feb 27, 2017 at 11:33 AM.


